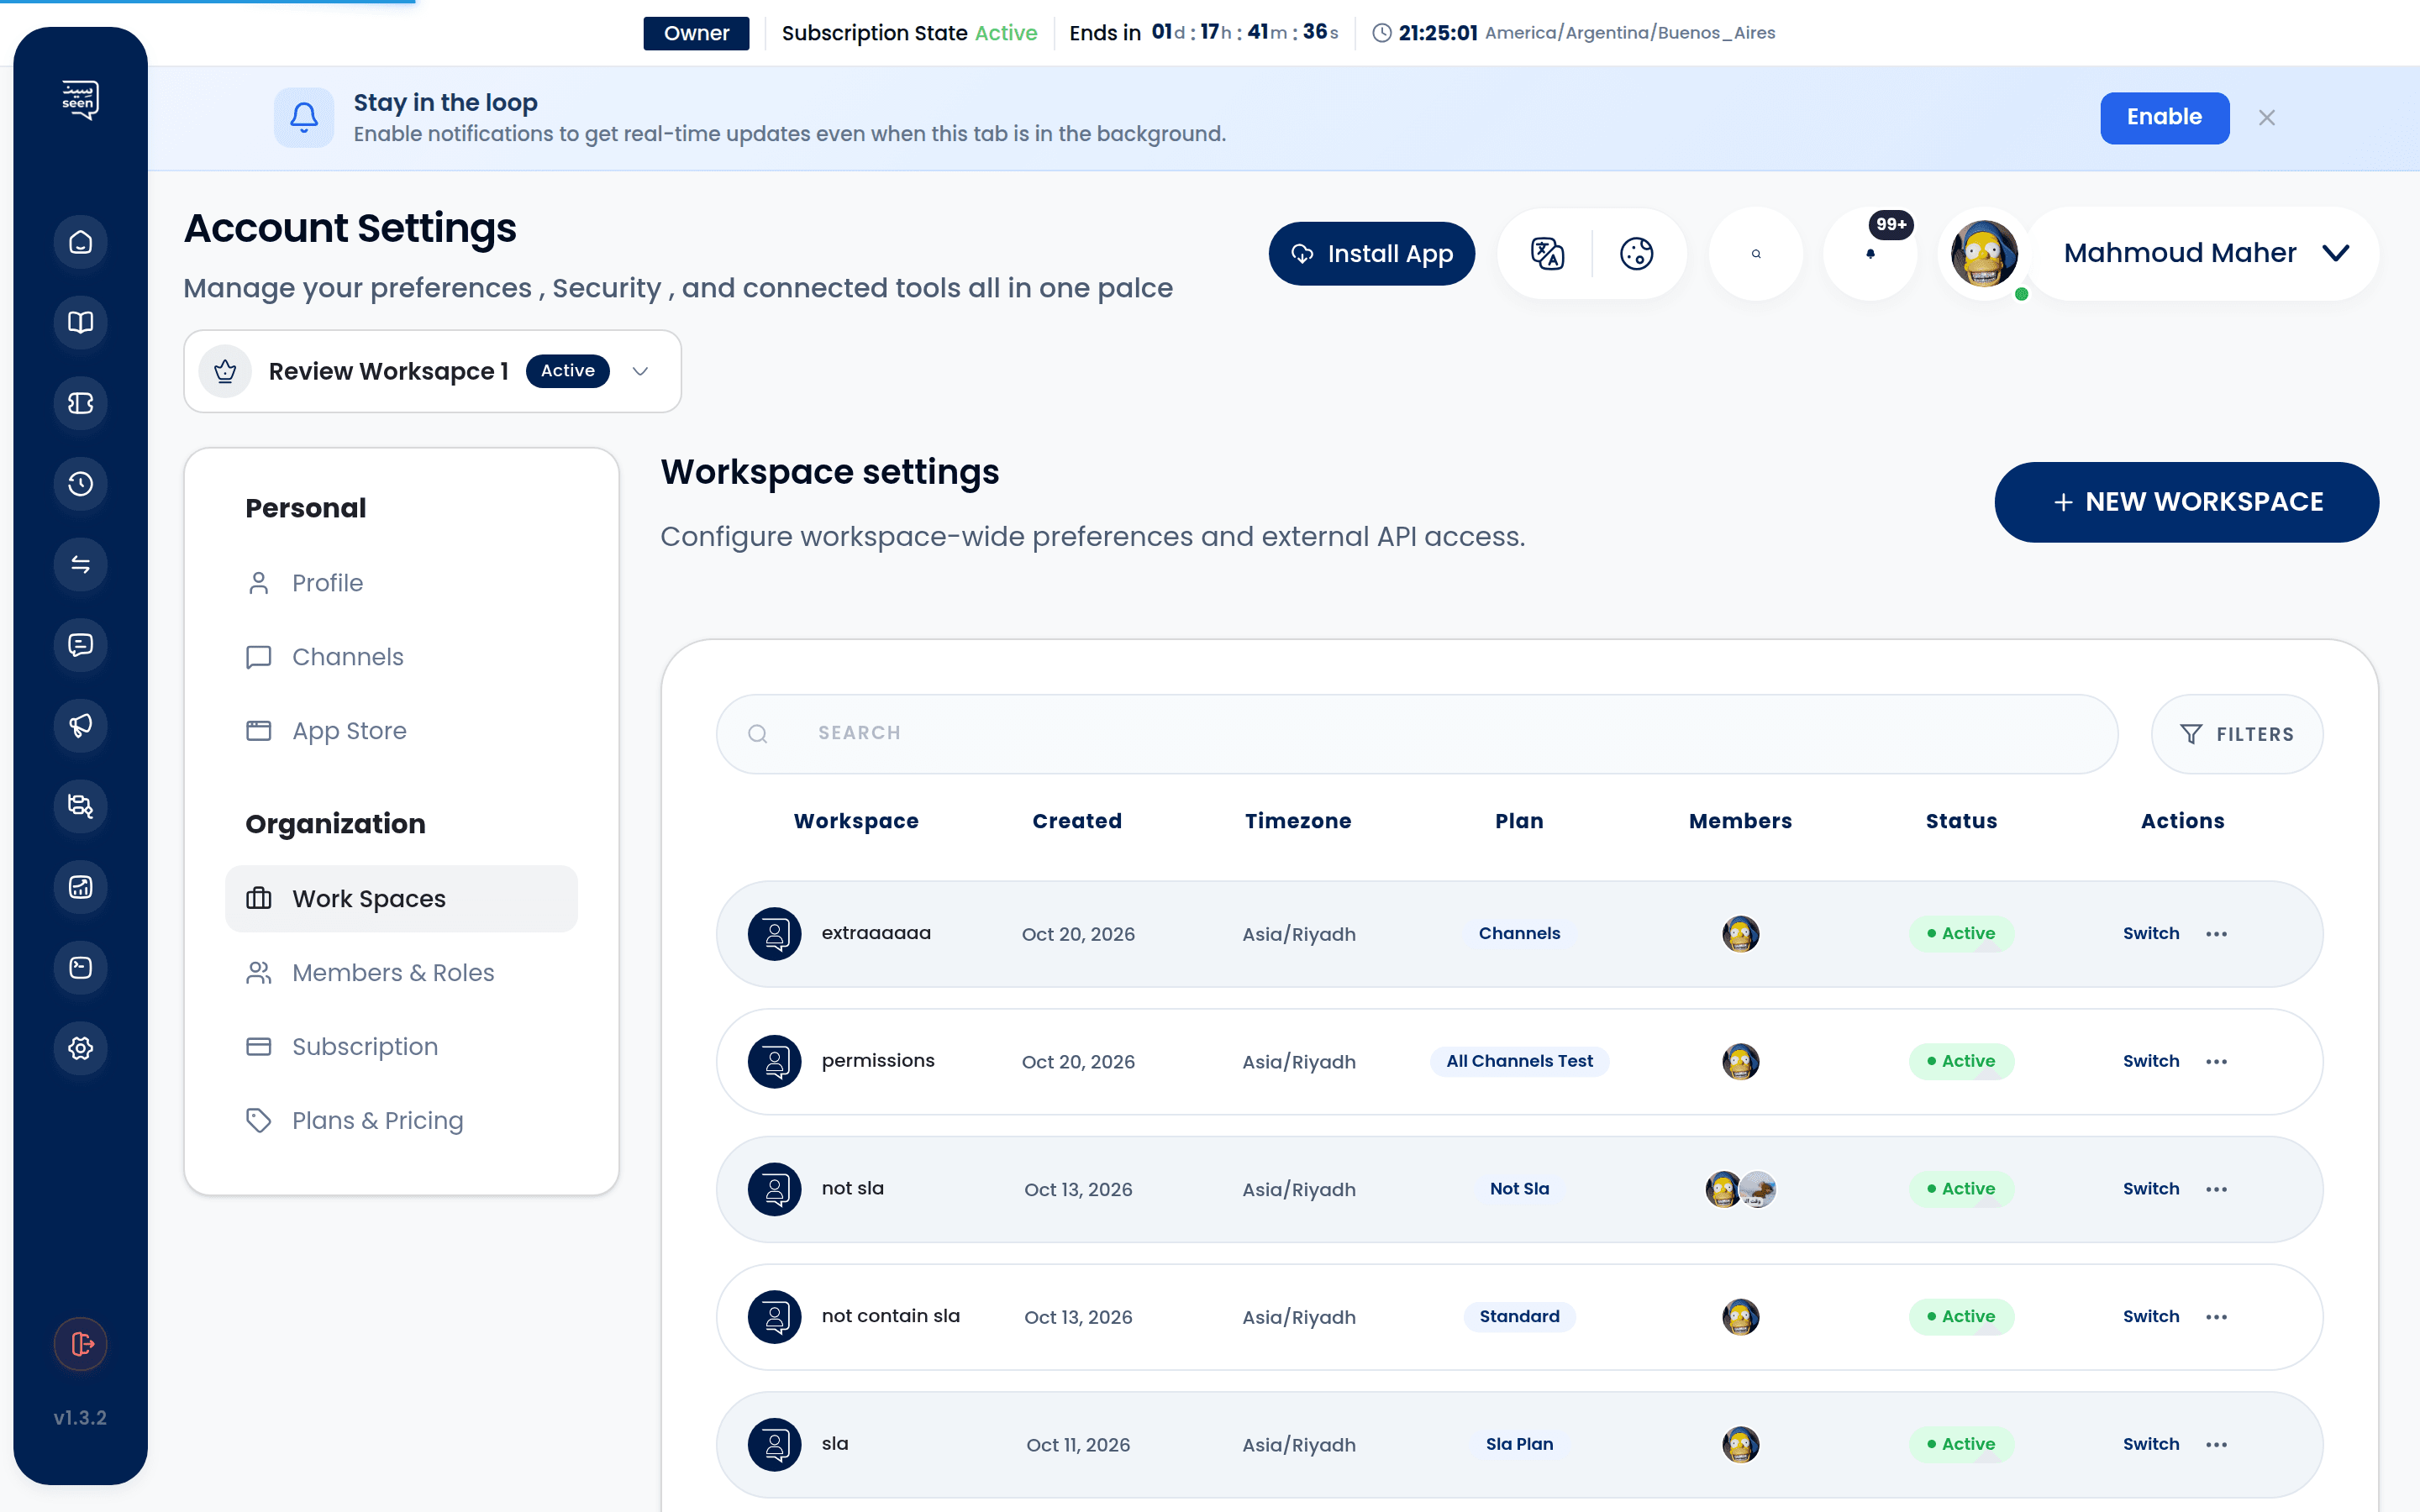
Dashboard & Operational Analytics Overview in Seen
The Seen Dashboard serves as the central command cockpit for your entire omnichannel customer engagement and sales operation. Providing real-time, consolidated intelligence across every connected touchpoint—including WhatsApp Business API, Instagram Direct, Facebook Messenger, and Telegram—the dashboard empowers support supervisors, sales leads, and operations managers to maintain operational excellence, track team response speed, and prevent service bottlenecks before they impact customer satisfaction.
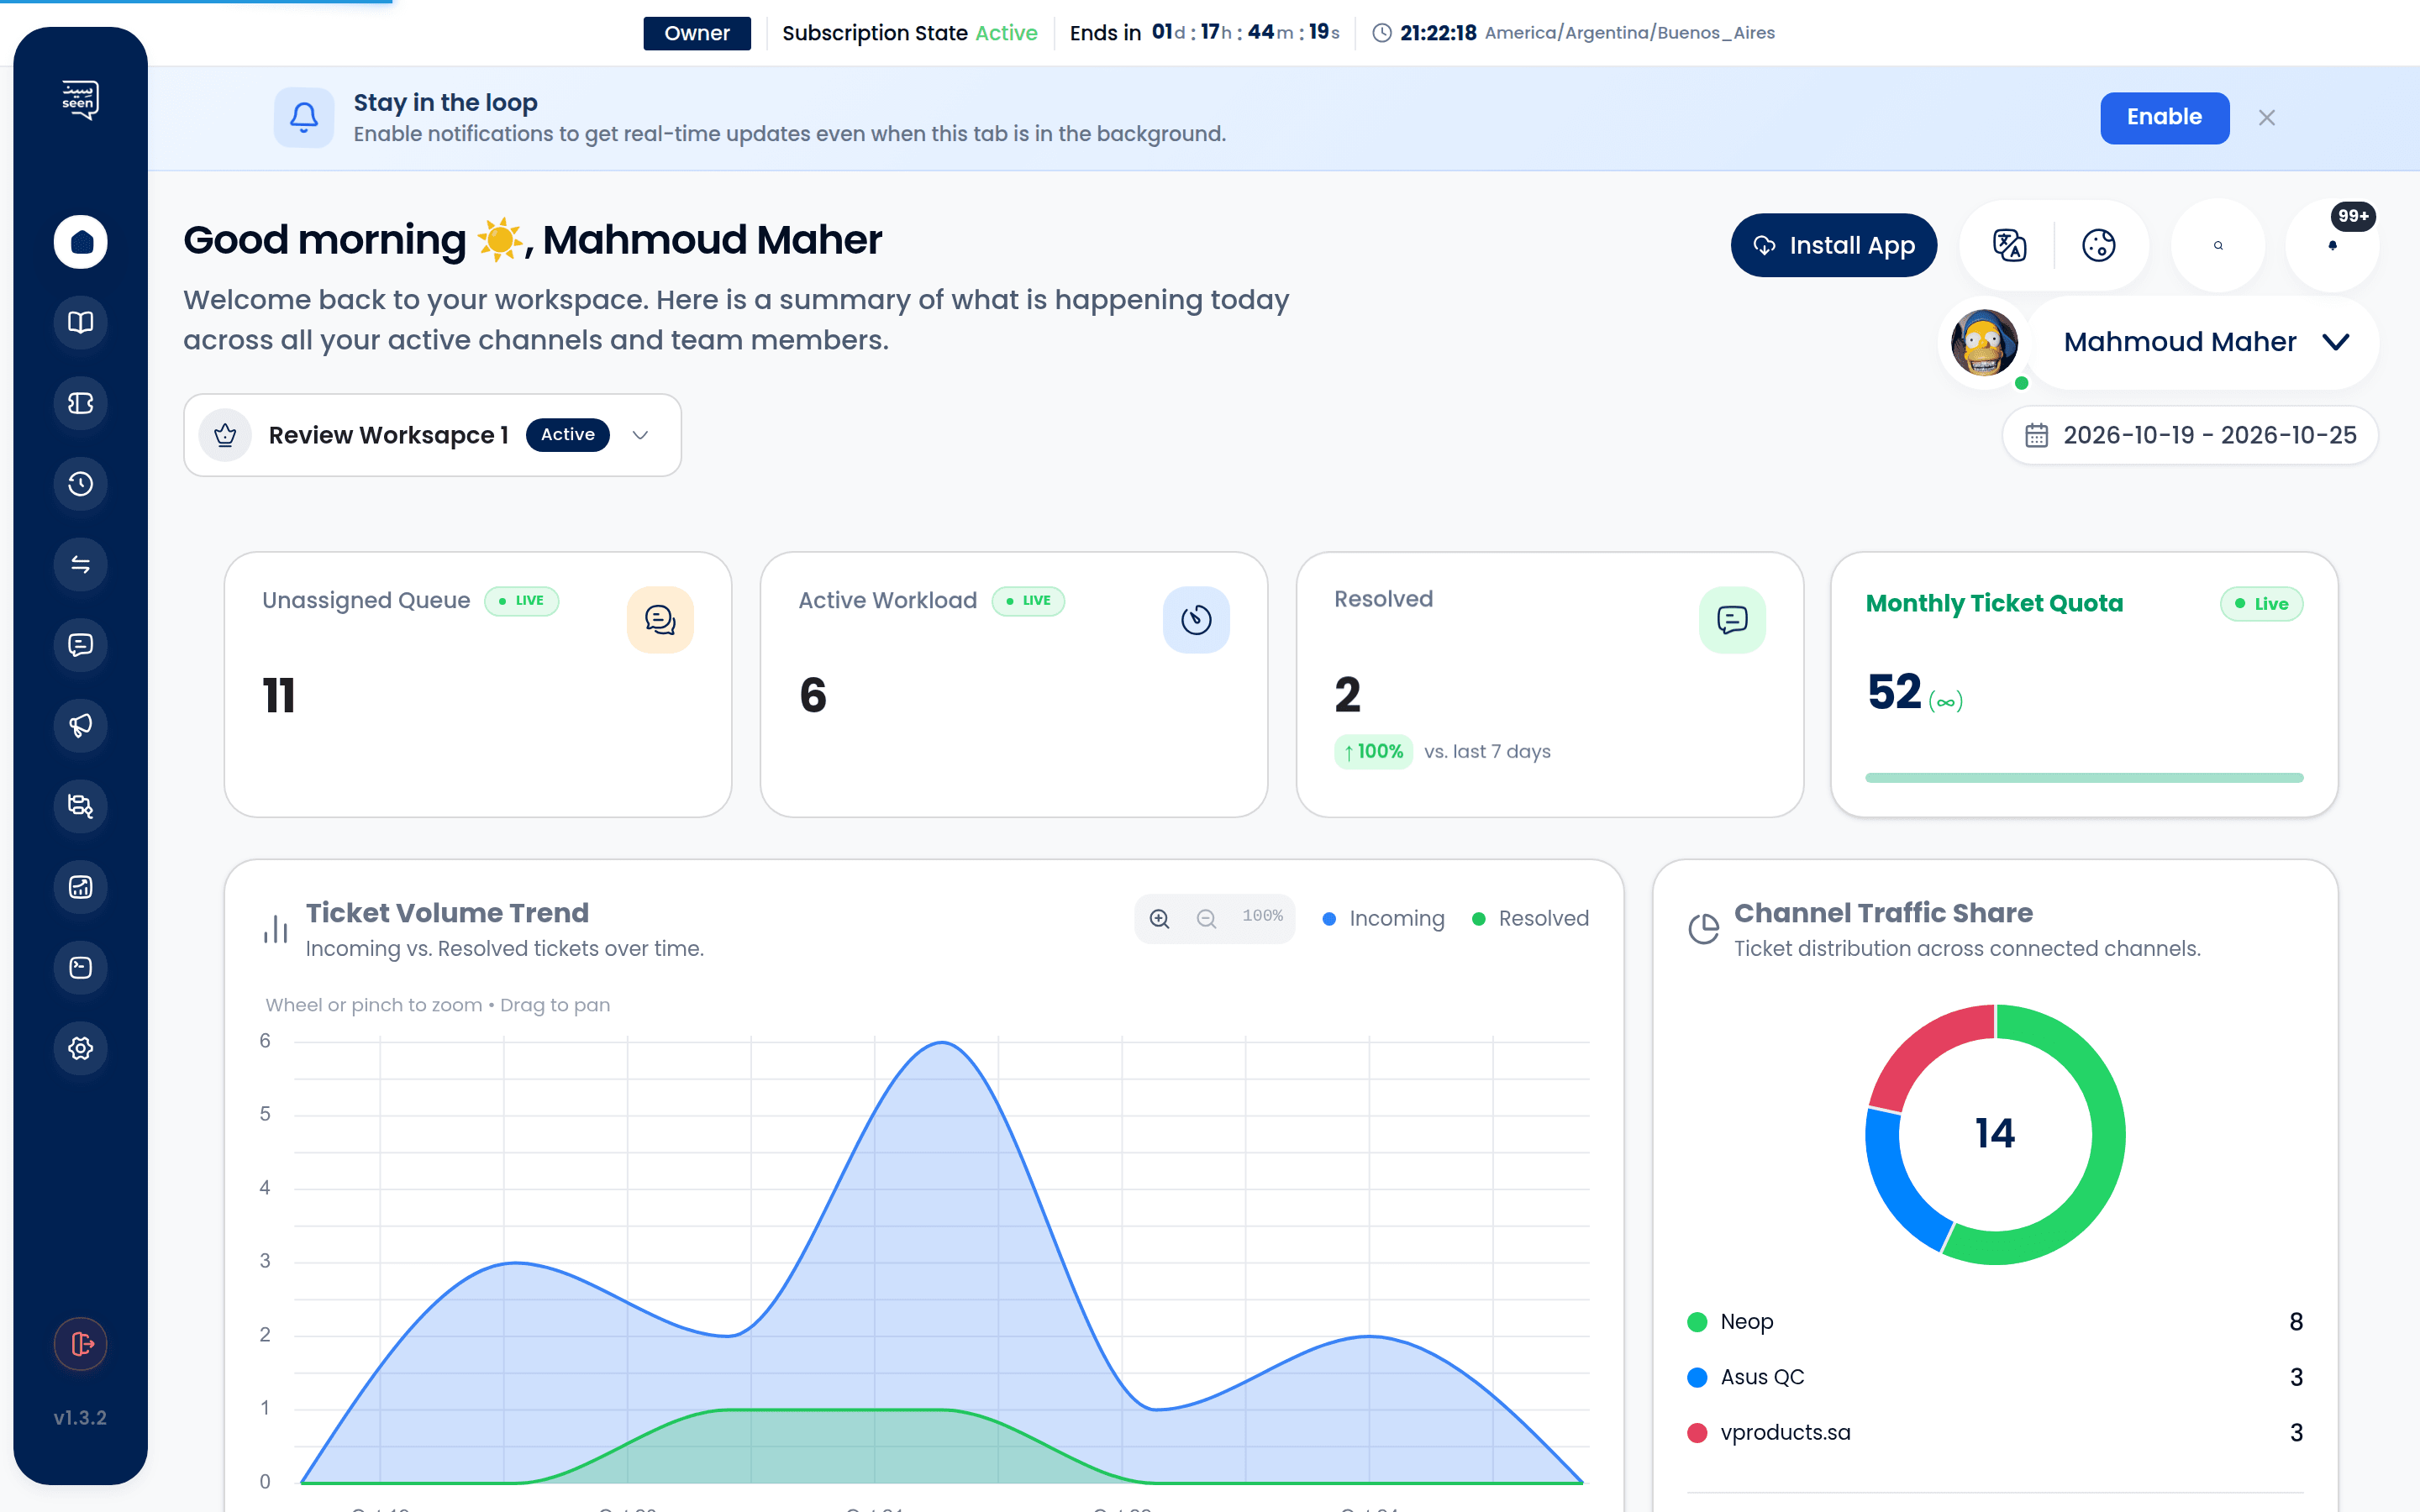
1. Header Controls & Date Filtering
At the top of the dashboard, interactive controls allow you to filter telemetry and align metrics with your business cycles:
- Date Range Selector: Effortlessly switch between predefined presets or configure custom windows:
- Today: Real-time snapshot of the current operational shift and incoming traffic volume.
- Last 7 Days: Week-over-week performance comparisons and peak hours analysis.
- Last 30 Days: Strategic monthly trends, backlog velocity, and cumulative engagement.
- Custom Range: Tailored date boundaries matching your marketing pushes, Black Friday promotions, or seasonal campaigns.
- Live Pulse Indicator: Displays real-time WebSocket connection status, refreshing counts dynamically without requiring manual browser reloads.
- Quick Action Triggers: Instant shortcut buttons to launch into the Unified Inbox, draft a new broadcast campaign, or adjust your workspace subscription.
Tip: Support leads should review the "Today" filter at mid-day and shift handover to ensure unassigned queues are balanced across available agents.
2. Key Performance Indicators (KPIs)
Four high-visibility cards prominently showcase the primary indicators of customer service health:
Total Tickets
Aggregates total customer conversation lifecycles created during the selected window, sub-divided by status:
- Open: Tickets awaiting agent action or active customer engagement.
- Pending: Conversations temporarily suspended awaiting customer input or third-party approval.
- Resolved / Closed: Customer inquiries successfully addressed and resolved.
First Response Time (FRT)
Measures the duration (in minutes and seconds) from when a customer sends their initial incoming inquiry until a human agent dispatches the first manual reply.
- Automated greetings and chatbot responses generated by the Visual Flow Builder are deliberately excluded to ensure genuine human performance measurement.
- Directly feeds into your configured SLA Policies.
Average Resolution Time (RT)
The total lifecycle duration from initial ticket creation until the conversation is formally marked as Resolved or Closed.
Message Volume & Velocity
Cumulative tally of all outbound and inbound messages exchanged across channels, paired with comparative percentage badges showing growth or reduction against the prior period.
| Metric | Operational Purpose | Recommended Target Benchmark |
|---|---|---|
| FRT (First Response Time) | Speed of acknowledging a customer inquiry | Under 15 minutes |
| RT (Resolution Time) | Complete time to resolve the inquiry | Under 4 hours |
| Daily Close Ratio | Closed tickets compared to new open tickets | Above 85% |
| SLA Compliance Rate | Conversations concluded without breaching SLA | Above 95% |
3. Subscription Quotas & Resource Consumption (Quota Card)
The Quota Card delivers granular visibility into your current billing tier usage:
- Monthly Message Quota: Percentage of included platform message volume consumed during the current billing month.
- Daily WhatsApp Cloud Tier Limit: Tracks Meta's 24-hour rolling phone tier limits (Tier 1: 1k, Tier 2: 10k, Tier 3: 100k, or Unlimited distinct contacts per 24 hours).
- Monthly Active Contacts (MAC): Unique customer profiles with active inbound or outbound conversations during the billing cycle.
- Threshold Alerts: Visual warnings when consumption crosses 80% and 90%, allowing managers to upgrade seamlessly before messages are restricted.
Warning: Exhausting your monthly message quota may temporarily pause outgoing mass broadcasts and automated campaign dispatches, though inbound customer messages will always continue to arrive safely in the inbox.
4. Interactive Ticket Flow Chart (DashboardTicketChart)
This dynamic time-series graph visualizes conversation velocity across time:
- Dynamic Granularity: Automatically adapts between hourly breakdown (
ticketChartGranularity) when viewing "Today", to daily bars for week and month views. - Status Color Legend:
- Blue: New and Open tickets.
- Orange: In Progress conversations actively claimed by agents.
- Gray: Successfully closed tickets.
- Purple: Reopened conversations where customers replied after resolution.
- Peak Hour Detection: Pinpoints recurring high-volume spikes throughout the day, allowing workforce managers to optimize staffing schedules accordingly.
5. Channel Traffic Distribution (Channel Traffic Donut)
For workspaces operating multi-channel setups, the donut visualization highlights the share of incoming and outgoing traffic per provider:
- WhatsApp Cloud API: Typically the highest-engagement channel for direct purchases and instant support.
- Instagram Direct Messages: Story mentions, story replies, and product catalog inquiries.
- Facebook Messenger: Queries arriving from your linked Facebook Business Page.
- Telegram Bot: Technical community hubs, alerts, and developer inquiries.
Use these insights to determine which channels generate the highest conversion rates and allocate agent expertise accordingly.
6. Live Broadcasts Telemetry (Broadcasts Summary)
Directly linked with the Broadcast Module, this widget tracks campaign metrics:
- Active Campaigns: Real-time progress bars for marketing broadcasts currently processing.
- Delivery Funnel:
- Sent: Dispatched from Seen servers to Meta's infrastructure.
- Delivered: Reached the recipient's handset (double gray checks).
- Read: Opened by the recipient (double blue checks).
- Failed: Bounce rate caused by invalid numbers, network issues, or blocked accounts.
7. Flow Automation Performance (Flow Automation Widget)
Monitors the health and efficiency of your automated conversational bots built in the Visual Flow Builder:
- Active Bot Sessions: Live conversations currently navigating flow branches.
- Automated Resolution Rate: Percentage of customer inquiries resolved entirely by bot flows without human intervention.
- Agent Handoff Volume: Conversations that triggered an "Assign to Agent" node for escalated human attention.
8. Team Capacity & Agent Utilization (Team Capacity)
Keep a pulse on your support roster in real-time:
- Online / Available Agents: Personnel currently logged in with active sessions.
- Assigned Workload: Real-time count of unresolved tickets held by each individual agent.
- Capacity Overload Warning: Flags agents whose active ticket load exceeds recommended operational thresholds (e.g. 15+ concurrent tickets), signaling the need for reassignment via the Unified Inbox.
9. SLA Compliance Health (DashboardSlaStatus)
Directly integrates with your SLA Policies & Business Hours:
- Overall Compliance %: Ratio of tickets answered and resolved within policy thresholds.
- On Track: Safe tickets with ample time remaining (Green badge).
- At Risk: Tickets nearing their response or resolution deadlines (Amber badge).
- Breached: Inquiries that have officially elapsed past SLA limits (Red badge).
- Quick Configure Button: Opens the
SlaPolicyDialogmodal to adjust response targets on the fly without navigating away.
Step-by-Step: The Manager's Daily Dashboard Routine
- Shift Kickoff (09:00 AM):
- Select the "Today" filter and inspect the Open Tickets count.
- Verify unassigned overnight inquiries are allocated to active online team members.
- Review the SLA Status card to resolve any urgent or At Risk conversations immediately.
- Mid-Day Health Check (01:00 PM):
- Review Team Capacity to ensure ticket distribution is balanced and no single agent is overwhelmed.
- Check the Quota Card before launching large-scale promotional broadcasts.
- End-of-Day Review (05:00 PM):
- Switch to the "Last 7 Days" view to benchmark day-end numbers against weekly averages.
- Review First Response Time (FRT) and Resolution Time (RT) metrics to celebrate high-performing team members and identify coaching opportunities.
Note: Dashboard analytics update automatically in real time as tickets transition across states, and time metrics respect the configured Business Hours.
Frequently Asked Questions
Does an automated chatbot greeting stop the First Response Time (FRT) clock?
No. Seen strictly defines First Response Time (FRT) as the elapsed duration until an authentic human agent sends their initial manual message. Bot greetings, automated triggers, and out-of-office autoreplies do not pause the SLA timer, ensuring your metrics reflect actual customer wait times for real human service.
Why do tickets appear as SLA Breached over the weekend?
If your SLA policy is configured with "Calendar Hours (24/7)" instead of "Business Hours", the SLA countdown continues through non-working periods. Visit SLA Policies and activate your company's official operating schedule so the timer automatically freezes during weekends and off-duty hours.
Can junior agents access overall executive dashboard analytics?
Access permissions are strictly governed by Users, Roles & Permissions. While Workspace Owners and Administrators enjoy unrestricted access to organization-wide metrics, custom roles can be configured to restrict agents to their personal performance dashboards only.