Agent Performance Reports & Team Analytics in Seen
The Agent Performance Reports module within Seen delivers executive-grade operational visibility into individual and team-level efficiency for customer support directors, sales managers, and contact center leads. By translating tens of thousands of real-time messaging interactions into standardized quantitative benchmarks, Seen empowers leaders to recognize stellar talent, uncover training opportunities, and optimize roster distribution to maximize customer loyalty.
1. Core Operational Metrics per Agent
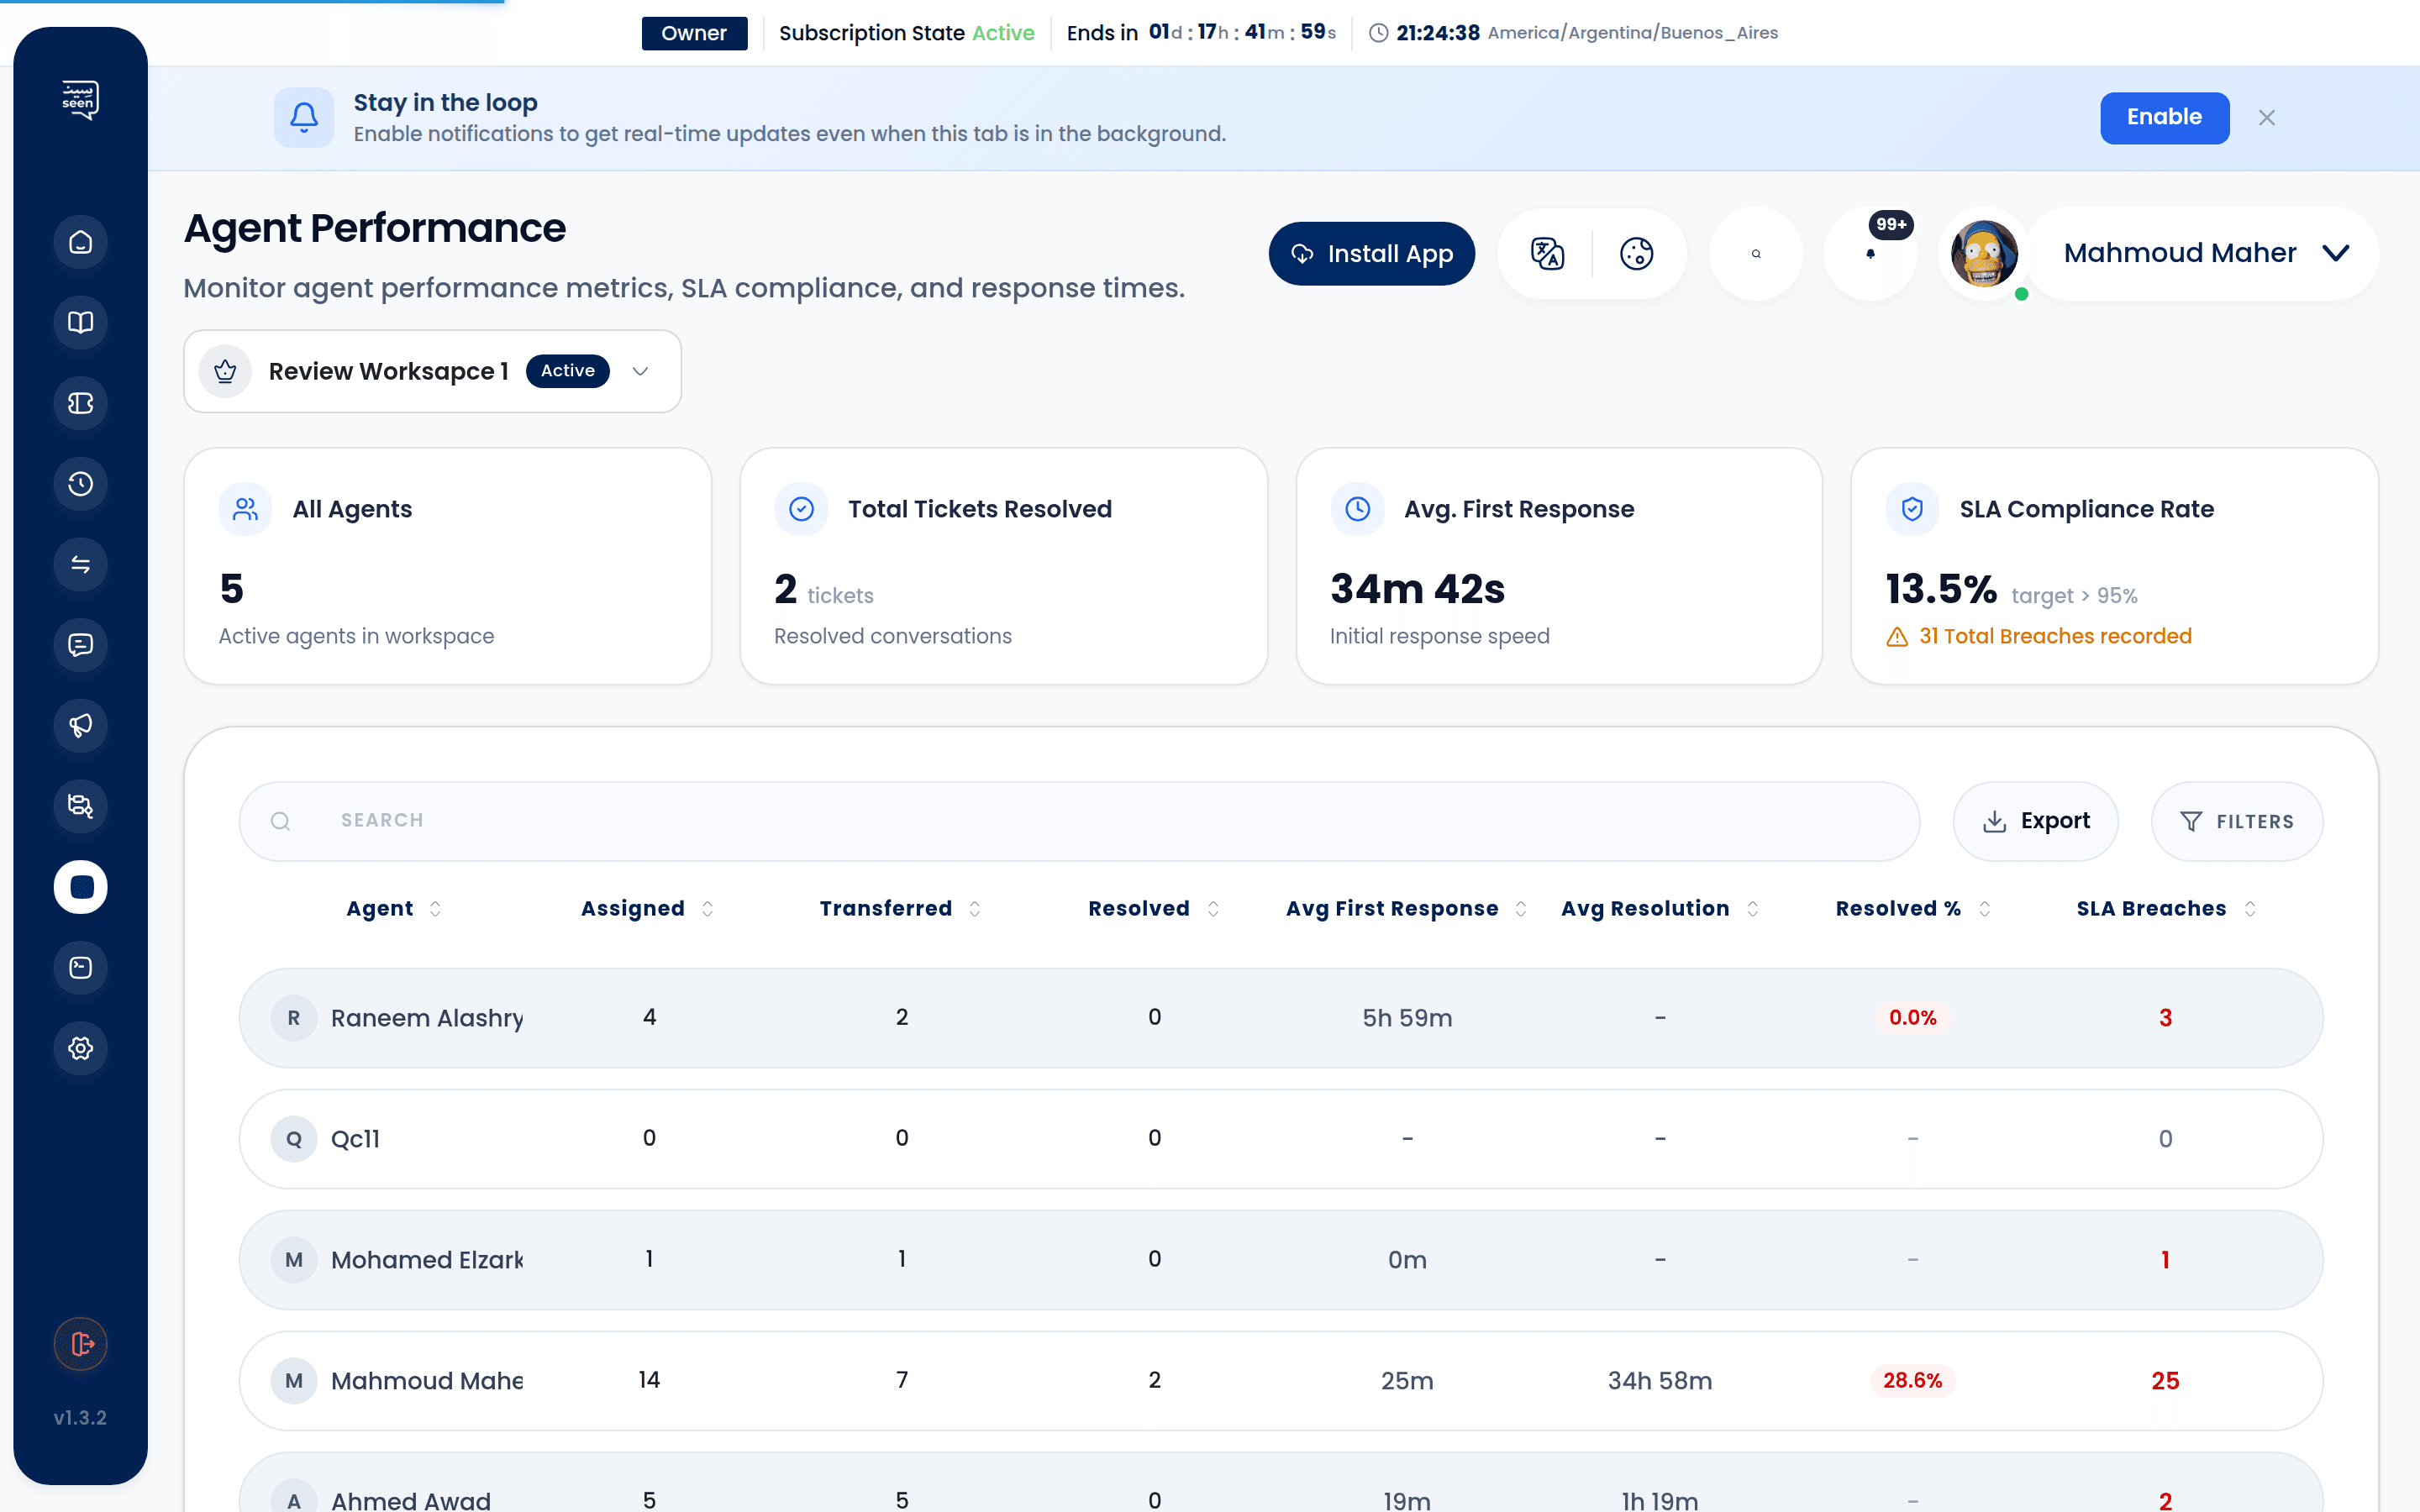
The reporting grid delivers an exhaustive breakdown of performance metrics attributed to each team member during the designated window:
A) Total Handled Tickets
Measures overall workload volume handled by the agent:
- Assigned Tickets: Total conversation threads routed to the agent.
- Resolved / Closed Tickets: Conversations successfully brought to completion.
- Resolution Ratio: Percentage of assigned inquiries successfully concluded.
B) Average First Response Time (FRT)
The average duration (minutes and seconds) elapsed from when a customer sends their initial ticket message until the agent dispatches their first manual reply.
- Serves as the prime indicator of agent attentiveness and responsiveness.
- Directly evaluated against your configured SLA Policies.
C) Average Resolution Time (RT)
The average lifecycle time required from ticket inception to final resolution, measuring an agent's technical acumen and troubleshooting efficiency.
D) SLA Compliance Percentage
The proportion of conversations serviced and resolved within your official SLA target windows without recording a breach (is_breached).
E) Customer Satisfaction (CSAT) Rating
Aggregated customer feedback collected via automated post-resolution rating surveys (evaluated on a 1-to-5 star scale or satisfaction percentage).
F) Message Volume (Outbound vs Inbound)
Tracks raw manual message output per agent, highlighting the conversational effort invested into customer interactions.
2. Standard Industry Performance Benchmarks
| Metric | Operational Significance | Target Benchmark | Needs Improvement |
|---|---|---|---|
| First Response Time (FRT) | Speed of initial acknowledgment | Under 10 minutes | Over 30 minutes |
| Resolution Time (RT) | Total time to resolve customer issue | Under 2 hours | Over 6 hours |
| SLA Compliance Rate | Adherence to corporate service standards | Above 95% | Under 85% |
| CSAT Score | Customer sentiment post-interaction | Above 4.5 / 5.0 | Under 3.8 / 5.0 |
| Ticket Close Ratio | Proportion of tickets resolved vs assigned | Above 90% | Under 75% |
3. Multi-Dimensional Filtering & Cohort Analysis
Isolate and analyze team data with granular filter controls:
- Date Range Window:
- Today: Live operational tracking during active shifts.
- Last 7 Days: Weekly performance reviews and standup meetings.
- Last 30 Days / This Month: Monthly incentive calculations and performance evaluations.
- Custom Range: Targeted evaluation periods matching flash sales or seasonal surges.
- Team / Department Filters:
- Filter by functional units (Sales Team, Tier 1 Support, VIP Support).
- Compare cross-departmental response times to balance staffing allocations.
- Channel Filters:
- Benchmark performance across specific platforms (e.g. WhatsApp vs Instagram vs Telegram).
4. Exporting Data to CSV / Excel for Payroll & BI
Seen allows one-click export of complete analytical data tables:
- Click the "Export CSV" button located at the top-right of the reporting table.
- The system instantaneously downloads a sanitized CSV file containing all granular metrics per agent.
- Import the dataset seamlessly into Microsoft Excel, Google Sheets, or enterprise BI dashboards (Power BI, Tableau).
- Utilize verified SLA compliance percentages and CSAT ratings as an objective, auditable foundation for performance bonuses.
Tip: Automate monthly data archiving by exporting reports on the first day of each calendar month to preserve historical performance trajectory records.
5. Supervisory Best Practices & Workload Balancing
Identifying Agent Overload Early
If an agent shows an unexpected drop in SLA compliance accompanied by elevated FRT, cross-reference their active ticket count in the Executive Dashboard. Excessive concurrent ticket loads inevitably cause response delays; reassign pending inquiries across online peers via the Unified Inbox to re-establish equilibrium.
Coaching on Low CSAT Conversations
When an agent receives an adverse CSAT rating, click the agent's name to isolate the specific conversation. Review the message history and use Internal Conversation Notes to provide constructive private feedback and coaching.
Frequently Asked Questions
How are metrics distributed when a ticket is transferred between agents?
When a ticket transfers via the Transfer Requests Workflow, Seen fairly splits credit: the initial agent retains attribution for the First Response Time (FRT), while the final resolving agent receives credit for the successful resolution and final CSAT score.
Does an agent's score drop for messages received outside business hours?
No. Provided your workspace has configured Business Hours in SLA Policies, countdown clocks freeze outside working shifts, safeguarding agent metrics against off-hours inquiries.
Can an administrator manually override or delete negative agent ratings?
No. All report data is immutably generated by system audit logs to guarantee compliance integrity and protect objective auditing standards across the organization.